
What is CAGR and How Does it Work in Stock Investments?
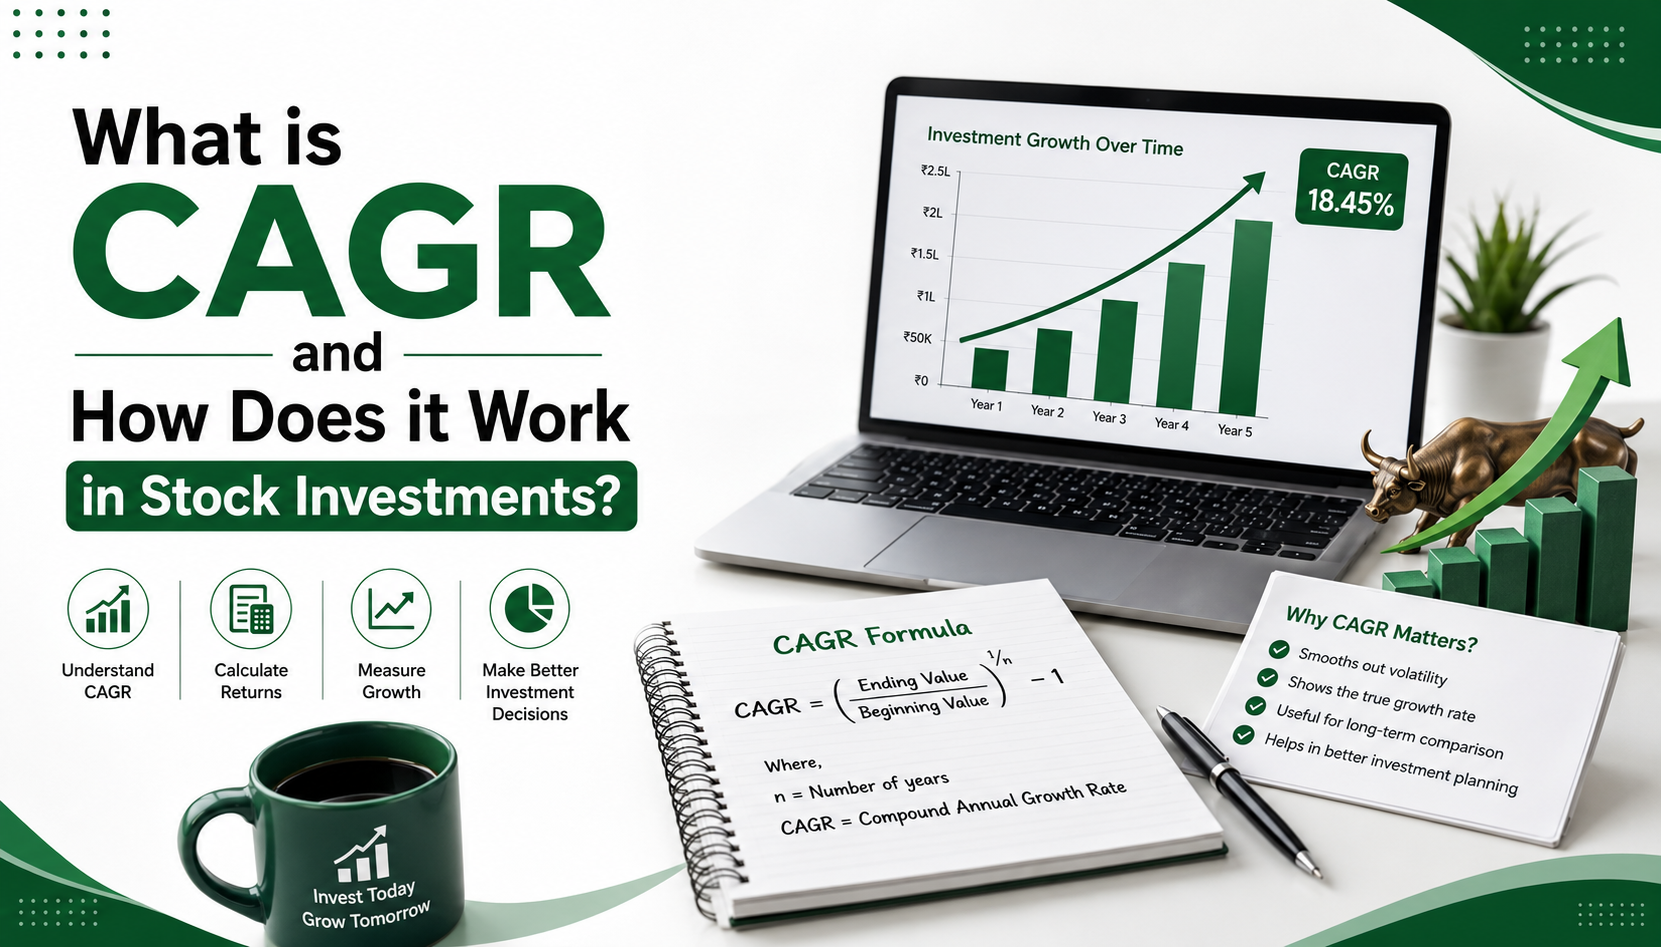
When investing in equities, mutual funds, or other financial instruments, tracking performance can often feel overwhelming. Market indices swing up and down daily, creating noise that can obscure your actual long-term progress. To cut through this volatility, experienced investors rely heavily on a single, standardized metric: the Compound Annual Growth Rate (CAGR).
What Exactly is CAGR?
Compound Annual Growth Rate represents the geometric progression ratio that provides a constant annual rate of return over a multi-year investment period. It assumes that all intermediate cash flows or profits are fully reinvested at the end of each compounding interval.
CAGR = (Ending Value / Beginning Value)(1 / n) − 1
Where Ending Value is current portfolio worth, Beginning Value is initial principal, and n is the time horizon in years.
Why CAGR Outperforms Absolute Returns in Analysis
Many novice investors look exclusively at absolute return numbers (e.g., "My stock portfolio is up 80%!"). While an 80% absolute gain sounds fantastic on paper, it lacks critical temporal context.
- Time Normalization: If an 80% gain took 1 year to achieve, that represents phenomenal wealth generation. However, if that same 80% gain required 10 years of holding time, the annualized compounding rate drops down to roughly 6.08% per year—which might underperform standard fixed-income options.
- Comparative Benchmarking: CAGR puts different asset classes—such as equity mutual funds, real estate holdings, and gold bonds—on a completely level playing field by annualizing their growth profiles over identical timelines.
A Practical Calculation Example
Imagine you invest ₹1,00,000 into a diversified equity portfolio. Over a span of 4 years, your investment capital compounds as follows:
- Initial Principal (Year 0): ₹1,00,000
- Ending Value (Year 4): ₹2,10,340
- Calculation Breakdown: $(2,10,340 / 1,00,000)^{(1/4)} - 1 = (2.1034)^{0.25} - 1 \approx 0.204$
This results in a 20.4% CAGR, indicating that your money grew at a steady compound rate of 20.4% annually over those four years.
Major Limitations Every Investor Should Know
Despite its widespread utility, CAGR is not a flawless metric. Reviewers and institutional analysts note the following key constraints:
- Smoothing Out Market Volatility: CAGR acts as a smoothed mathematical average. It completely masks intermediate drawdowns, severe bear markets, or high volatility spikes that occurred during the investment lifecycle.
- Past Performance Indicator: Historical CAGR numbers provide zero guarantee of future returns, especially in dynamic stock markets subject to macroeconomic shifts.
Conclusion
Understanding CAGR equips you to evaluate long-term financial performance objectively. By utilizing dedicated tools like our SIP Calculator and investment trackers, you can project future corpus values with greater confidence and build a disciplined wealth creation strategy.